Journal of Current Surgery, ISSN 1927-1298 print, 1927-1301 online, Open Access
Article copyright, the authors; Journal compilation copyright, J Curr Surg and Elmer Press Inc
Journal website https://jcs.elmerpub.com

Original Article

Volume 16, Number 2, September 2026, pages 40-48


Early Surgery in Crohn’s Disease: Clinical and Evolutionary Profile

Figure

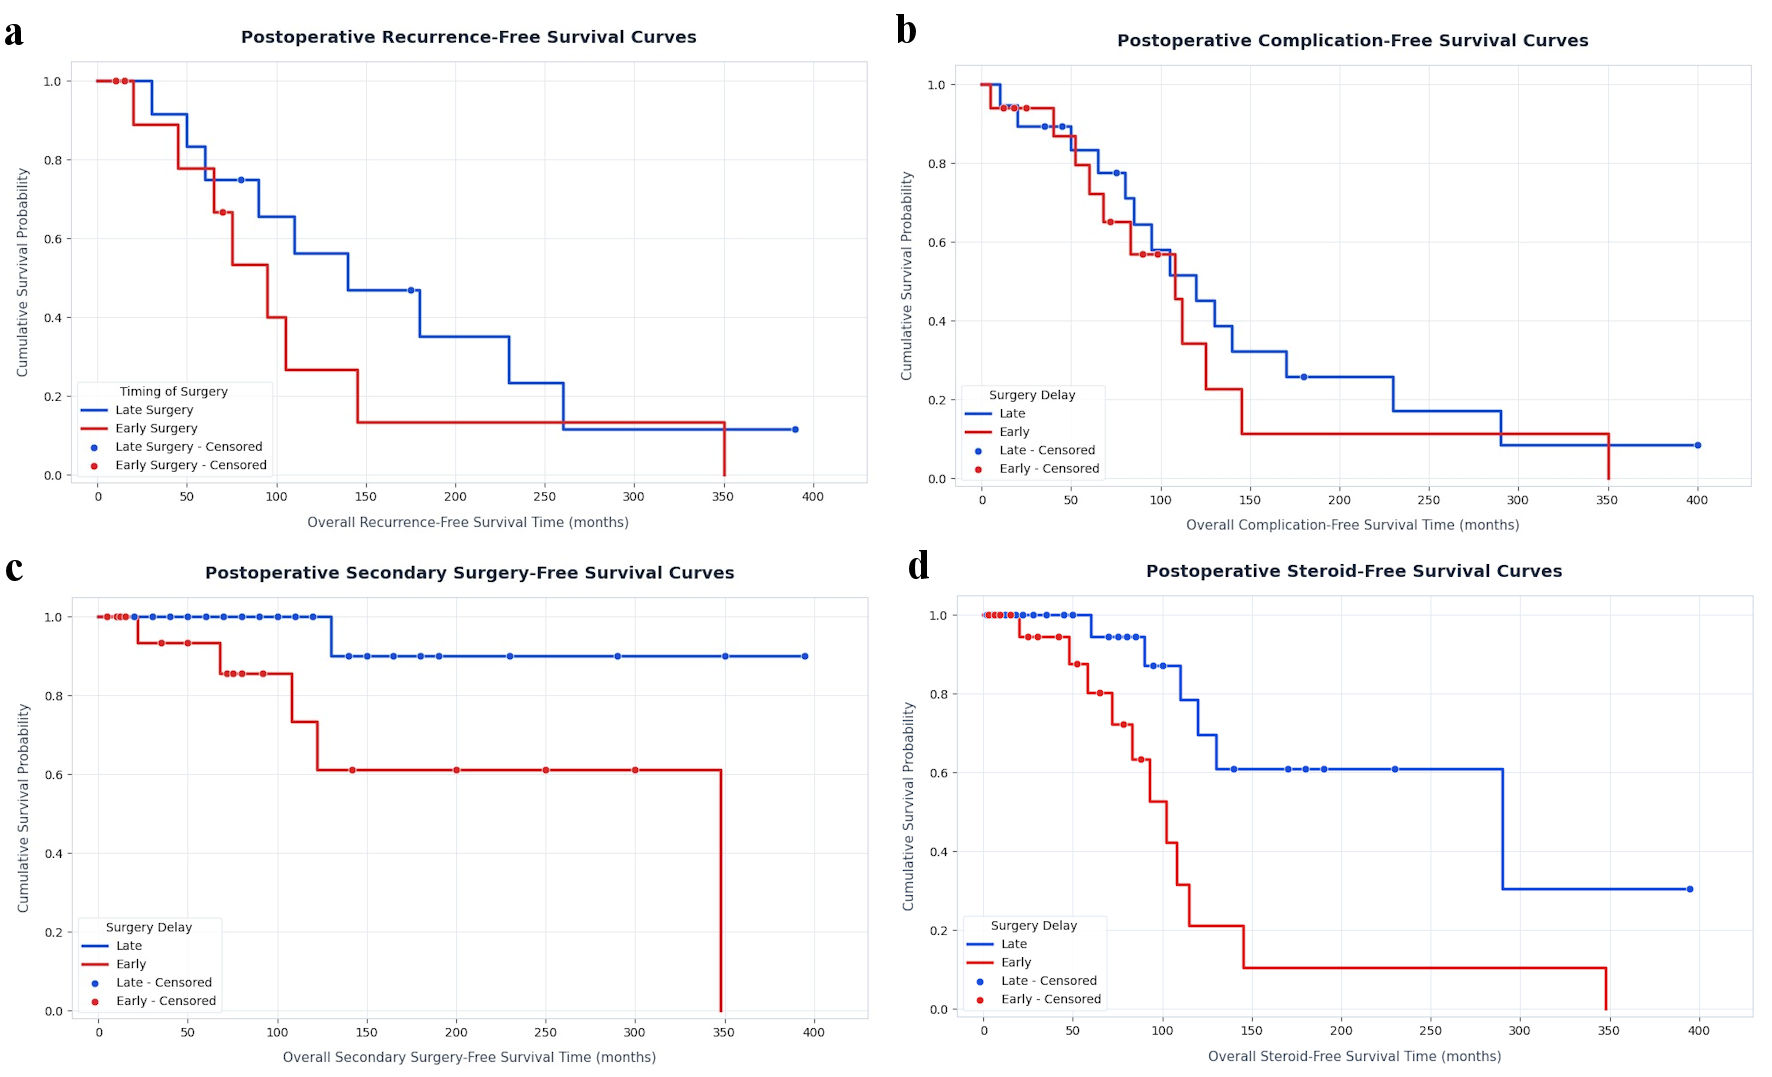
↓  Figure 1. Kaplan–Meier survival curve for (a) postoperative recurrence-free survival in early and late surgery groups; (b) postoperative adverse outcome-free survival in early and late surgery groups; (c) reoperation-free survival in early and late surgery groups; (d) corticosteroid-free survival in early and late surgery groups.
Figure 1.

Tables

↓  Table 1. Clinical and Biological Characteristics of the Patients at Diagnosis
 
ParametersSubcategoryPercentage (%)Mean values (extremes)
IBD: inflammatory bowel disease; BMI: body mass index; BIS: biological inflammatory syndrome; Hb: hemoglobin; WBC: white blood count; CRP: C-reactive protein.
Age at onset (Montreal classification)A16.739 ± 14 (16–73)
A251.6
A341.7
SexMale55Sex ratio (male/female) = 1.22
Female45
Smoking statusNon-smokers57.1
Active smokers42.9
Family history of IBD16.7
BMI (kg/m2)Underweight18.422.8 ± 5.2 (13.3–38.7)
Normal51.8
Overweight20.2
Obesity9.6
Initial presentationChronic diarrhea47.1
Subocclusive syndrome16.8
Abdominal pain14.3
Acute intestinal obstruction10
Other11.8
Disease location (Montreal classification)L143.3
L214.2
L342.5
Disease behavior (Montreal classification)B133.3
B240.8
B325.9
P (perianal)23.3
Anemia67.7Hb: 11.9 ± 2.3 (2.47–16.4)
BIS54WBC: 9,513 ± 4,761 (3,000–28,900)
CRP: 46.8 ± 50.8 (0–238)
Platelets: 381,819 ± 158,102 (127,000–975,000)


↓  Table 2. Postoperative Outcomes in Early Versus Late Surgery Groups
 
OutcomeEarly surgery (%)Late surgery (%)P
Clinical recurrence46420.56
Endoscopic recurrence41.953.80.37
Adverse outcomes (abscesses/stricture)25.8230.588
Reoperation16.13.80.0132
Corticosteroid treatment22.519.20.757
Therapy optimization35.530.80.7


↓  Table 3. Factors Associated With Early Surgery in Univariable and Multivariable Analysis
 
Univariable analysisMultivariable analysis
VariableEarly surgery (n = 31)Late/no surgery (n = 89)P valueOR (CI)P value
BMI: body mass index; ICV: ileocecal valve; CD: Crohn’s disease; OR: odds ratio; CI: confidence interval.
Nutritional status0.051.56 (0.97–2.51)
  Malnutrition7 (22.5%)14 (15.7%)
  Normal BMI20 (64.5%)39 (43.8%)
  Overweight2 (6.5%)21 (23.6%)
  Obesity1 (3.2%)10 (11.2%)
Initial presentation< 0.0017.39 (2.31–23.65)
  Intestinal obstruction8 (25.8%)4 (4.5%)
  Subocclusive symptoms8 (25.8%)12 (13.5%)
  Chronic diarrhea3 (9.7%)53 (59.6%)
  Abdominal pain6 (19.4%)11 (12.4%)
  Other6 (19.4%)9 (10%)
CD location0.0252.69 (1.25–5.79)
  L119(61.3%)33(37.1%)
  L21 (3.2%)16 (18%)
  L311 (35.5%)40 (44.9%)
CD behavior< 0.0010.042 (0.01–0.29)
  B11 (3.2%)39(43.8%)
  B215 (48.4%)34 (38.2%)
  B315(48.4%)16 (18%)
Endoscopic findings0.0133.09 (1.25–7.64)
  ICV stenosis8 (25.8%)9 (10.1%)
  Ulcerated ileitis3 (9.7%)25 (28.1%)
  Ulcerated ileocolitis6 (19.4%)20 (22.5%)
  Other9 (29%)27 (30.3%)
Complication at first imaging< 0.00110.33 (3.907–27.332)0.02
  Yes21 (67.7%)14 (15.7%)
  No10 (32.3%)75 (84.3%)
Corticosteroids at diagnosis0.0053.47 (1.42–8.47)0.016
  Yes9 (29%)52 (58.4%)
  No22 (71%)37 (41.6%)


↓  Table 4. Comparison of the Estimated Overall Follow-Up Duration According to Treatment Group
 
Estimated follow-up durationLate surgeryEarly surgeryNo surgery
159.2 months172.2 months144.65 months
P value0.003
0.966


↓  Table 5. Time-to-Event Analyses According to Treatment Group
 
EventEarly surgery (months)Late surgery (months)P value (early vs late)No surgery (months)P value (early vs no surgery)
New flare-ups128201.30.0271090.241
Postoperative adverse outcome167.62580.022
Reoperation209.6369.60.007
Corticosteroid use1602780.048
Therapeutic escalation127229.50.019116.50.517
Postoperative endoscopic recurrence118173.40.050